F1 – F6. Staffing and Committees
F1. Is there a bike program manager or primary point of contact for bicycling issues at your local government?
Erica Studdard – the Community Development Director, City of Carrollton, and a former Executive Director of Friends of Carrollton GreenBelt, LLC. Erica is a Complete Streets champion and hopes to create and promote livability, connectivity and healthy community.
- email: estuddard@carrollton-ga.gov,
- phone – City Hall: 770.830.2000
- Erica’s letter of support for the Bicycle Friendly Community application.
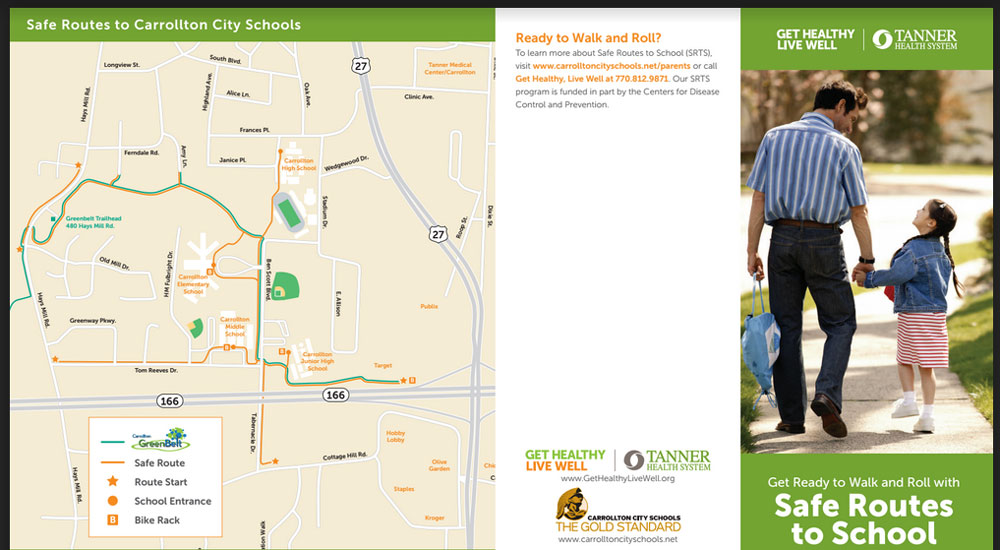
F2. Safe Routes to School
Phyllis Head, Community Outreach Coordinator at Tanner Health Systems. Tanner Health Systems is deeply involved in improving the health of the community.
- email: phead@tanner.org
- Safe Routes Resource Center
- SRTS Brochure printed by Tanner
- website: www.tanner.org/get-healthy-live-well
Jana Scoville, Parent Volunteer – Safe Routes to School Task Force. Jana succeeded Lori Blackmon as a SRTS contact for Parent Teacher Volunteer Organization (PTVO) with the City Schools.
- email: janascoville@gmail.com
- PTVO resources – SRTS
- PTVO resources – helmet fitting
Chelsea Carter, Safe Routes to School Georgia, Southwest Region / Carroll County
- email: Chelsea@SafeRoutesGA.org
- phone: 404.387.9579
- website: www.SafeRoutesGA.org
F3. How many government employees (including the Bicycle Program Manager and the Safe Routes to Schools Coordinator), expressed in full-time equivalents (FTE), work on bicycle issues in your community?
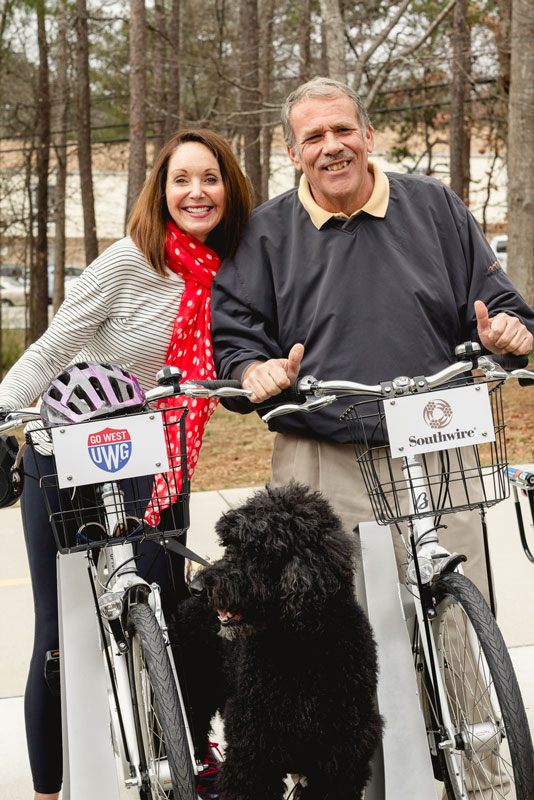
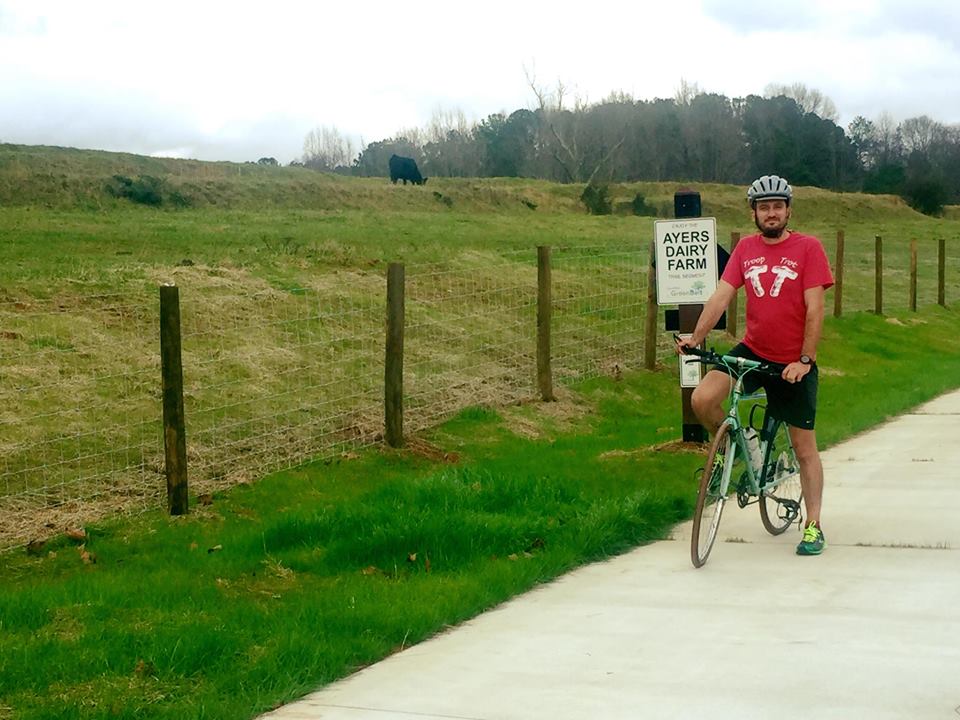
It is hard to pinpoint what exactly makes Carrollton special and it is even harder to define who would be the one person responsible for advancing bicycling in town. In the last 5 years, we have build a trail that not only encircles the city while going through 75 properties, but is also the longest paved loop in the state of Georgia. The 75 property owners who contributed their property to the project are unsung heroes of the community. We brought in a bike share program that was 100% sponsored by a local hospital – Tanner Health Systems, an industry leader – Southwire Company, and the University of West Georgia.
The University added bike lanes and bike/ped boulevards and works towards better bike connectivity with downtown Carrollton. Tanned applied for and received a CDC Community Transformation Grant. The grant money funds variety of a initiatives under the Get Healthy Live Well program that include, but are not limited to: forming a Complete Streets Committee, Safe Routes to School Task Force and the Bike Share Committee.

All those changes would not be possible without continued support of elected officials and hard work of the city staff. In the last year and a half, the City Council approved resolutions for the Complete Streets Policy, Zagster Bike Share, and Application for the Bicycle Friendly Community Designation, and proclaimed May as Bike Month in Carrollton, Georgia.
Rory Wojcik – Carrollton City Councilmember, works for the University of West Georgia. Rory joined the city council in January 2016. He is an avid supporter of walkable and bikable neighborhoods. Recently, he established the Neighborhood Safe Streets initiative with the City Police Department, and with the City Engineer on adding the 3-Feet-to-Pass-Bikes signage.
- email: rory@carrollton-ga.gov
- phone – City Hall: 770.830.2000
- Rory’s letter of support for the Bicycle Friendly Community application.
F5. Does your community have an officially-recognized Bicycle Advisory Committee?
Laura Richards – Founder and Chair, Friends of Carrollton GreenBelt, LLC. FoCGB serves as advisory board and implementation team for the Carrollton GreenBelt. The group is a grass-roots, community driven organization, funded by private donations. Laura is responsible for putting together the Carrollton GreenBelt implementation team and the 5-year-timeframe for building the trail.
- info@carrolltongreenbelt.com
- Laura’s letter of support for the Bicycle Friendly Community application.
Martyna Griffin – Vice President – Friends of Carrollton GreenBelt, LLC. FoCGB serves as advisory board and implementation team for the Carrollton GreenBelt. The group is a grass-roots, community driven organization, funded by private donations. Martyna joined FoCGB in August 2016, to assist the organization with trail compilation and programmatic initiatives.
- email: martynagriffin@gmail.com
F6. Does your local government have an internal equity, diversity, and inclusion (EDI) initiative, committee, or position?
The City of Carrollton does not have a formally adopted policy on equity, diversity, and inclusion. However, public project funding is allocated so that all residents, regardless of age, race, gender, or socioeconomic status, are encouraged to participate. For example, the City of Carrollton reviews access for public spaces when planning both passive and active recreation areas so that they can be easily accessed by bicycle or walking versus driving a car, a luxury not all residents have.
The City of Carrollton has recently focused park funding and streetscape improvements in disinvested areas of the city, including the construction of Legends West Park ($566,000) and sidewalk improvements to Alabama Street ($200,000). The City of Carrollton also spearheaded the first publicly sponsored Little Free Pantry program in the state of Georgia. These “pantries” provide a way for the general public to donate or take food without the stigma or embarrassment sometimes associated with traditional food donation programs. Additionally, the Carrollton GreenBelt connects these areas that are burdened with poverty to valuable city resources, such as shopping, employment, and schools.
F7 – F11. Planning, Funding, and Implementation
F7. Does your community have a comprehensive bicycle master plan or similar section in another document?
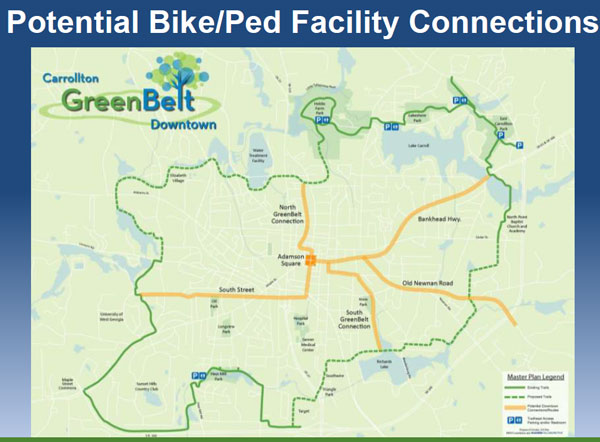
The Carrollton GreenBelt Implementation Plan and Cost Summary was created in summer 2011. The total 5 year budget for implementation of the plan was just under $17,000,000, averaged around $3,400,000 annually, and was funded through a public-private partnership with the City of Carrollton anf the Friends of Carrollton GreenBelt. Construction was divided into 17 phases and averaged completing 3 to 4 phases a year. With some segments longer and more complicated than others, the number of goals varied, however, the Plan was implemented on time, not only meeting but exceeding the initial trail length of 16 miles.
In addition to the Carrollton GreenBelt Implementation plan, the Bicycle Planning ITG – Inside the GreenBelt plan was created while planning additional bicycle improvements.
F8. What other local agencies have a bicycle master plan or similar section in another transportation demand management document?
- Carrollton Parks, Recreation and Cultural Arts Department (CPRCAD) maintains its national accreditation (CAPRA) and had recently published a 20-year Master Plan. The Carrollton GreenBelt is considered a linear park and falls under the CPRCAD’s jurisdiction and maintenance.
- Regional Planning Commission – Three Rivers Regional Commission, prepared the Bicycle and Pedestrian Plan Commission for the Georgia Department of Transportation.
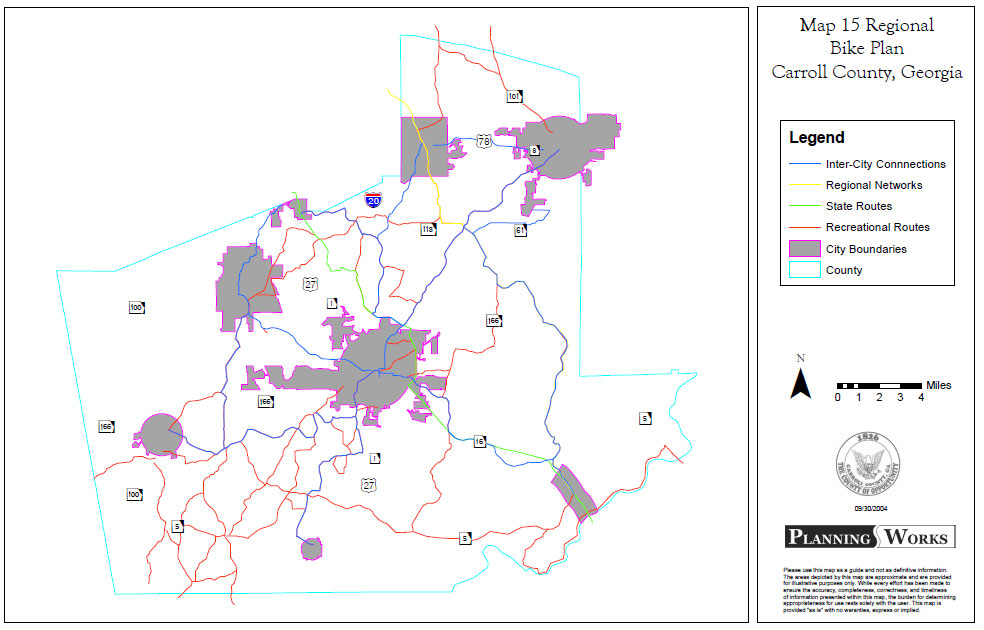
- Carroll County Long Range Transportation Plan – The Georgia Department of Transportation (GDOT) Office of Planning, in conjunction with Carroll County, initiated the development of a Long Range Transportation Plan (LRTP) to guide transportation planning decisions in Carroll County through 2040. The development of the Carroll County LRTP includes an in-depth look at transportation and economic conditions in order to identify potential projects that address existing and future transportation needs.
This study will evaluate multiple modes including public transit, bicycle and pedestrian, rail, and freight and the transportation infrastructure serving each mode. The Transportation Plan is built upon existing work efforts to date, and provide a mechanism for guiding future transportation decision-making.
In addition to the Long Range Transportation Plan , Carroll County also discusses transportation in the update to the county’s Comprehensive Plan, in CHAPTER VI. TRANSPORTATION.
The Comprehensive Plan features Carroll County Bicycle Network Plan:
F9. Is community-wide bicycle planning integrated with planning for any of the following: Check all that apply.
- Carrollton City Schools. One of the first segments of the Carrollton GreenBelt constructed went through the City Schools campus. The CCS serve about 5,000 students and the trail provided cut-throughs to neighborhoods previously not connected to schools via sidewalk or road.
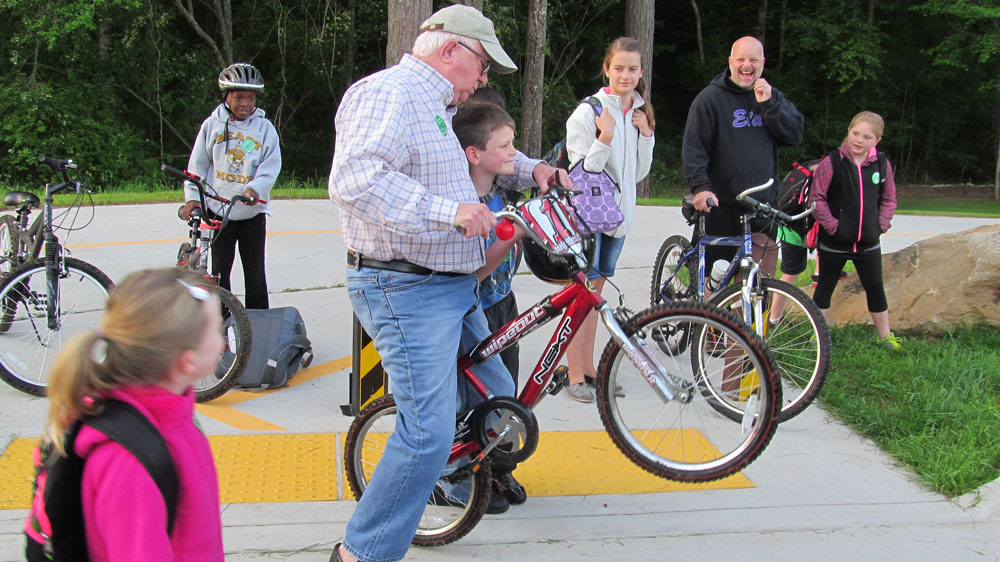
The 2015 Walk Audit was attended by Tanner Health System/GHLW, Carrollton City management, school administration from all four schools, law enforcement, fire department, Friends of the Carrollton Greenbelt, the Georgia SRTS Resource Center and community members. Input was received regarding the current traffic patterns during morning drop-off and afternoon activities. The information collected from this Walk Audit is provided to assist the Carrollton Safe Routes to School Task Force to develop an effective plan to enable Carrollton children and their families to walk and bicycle to school.
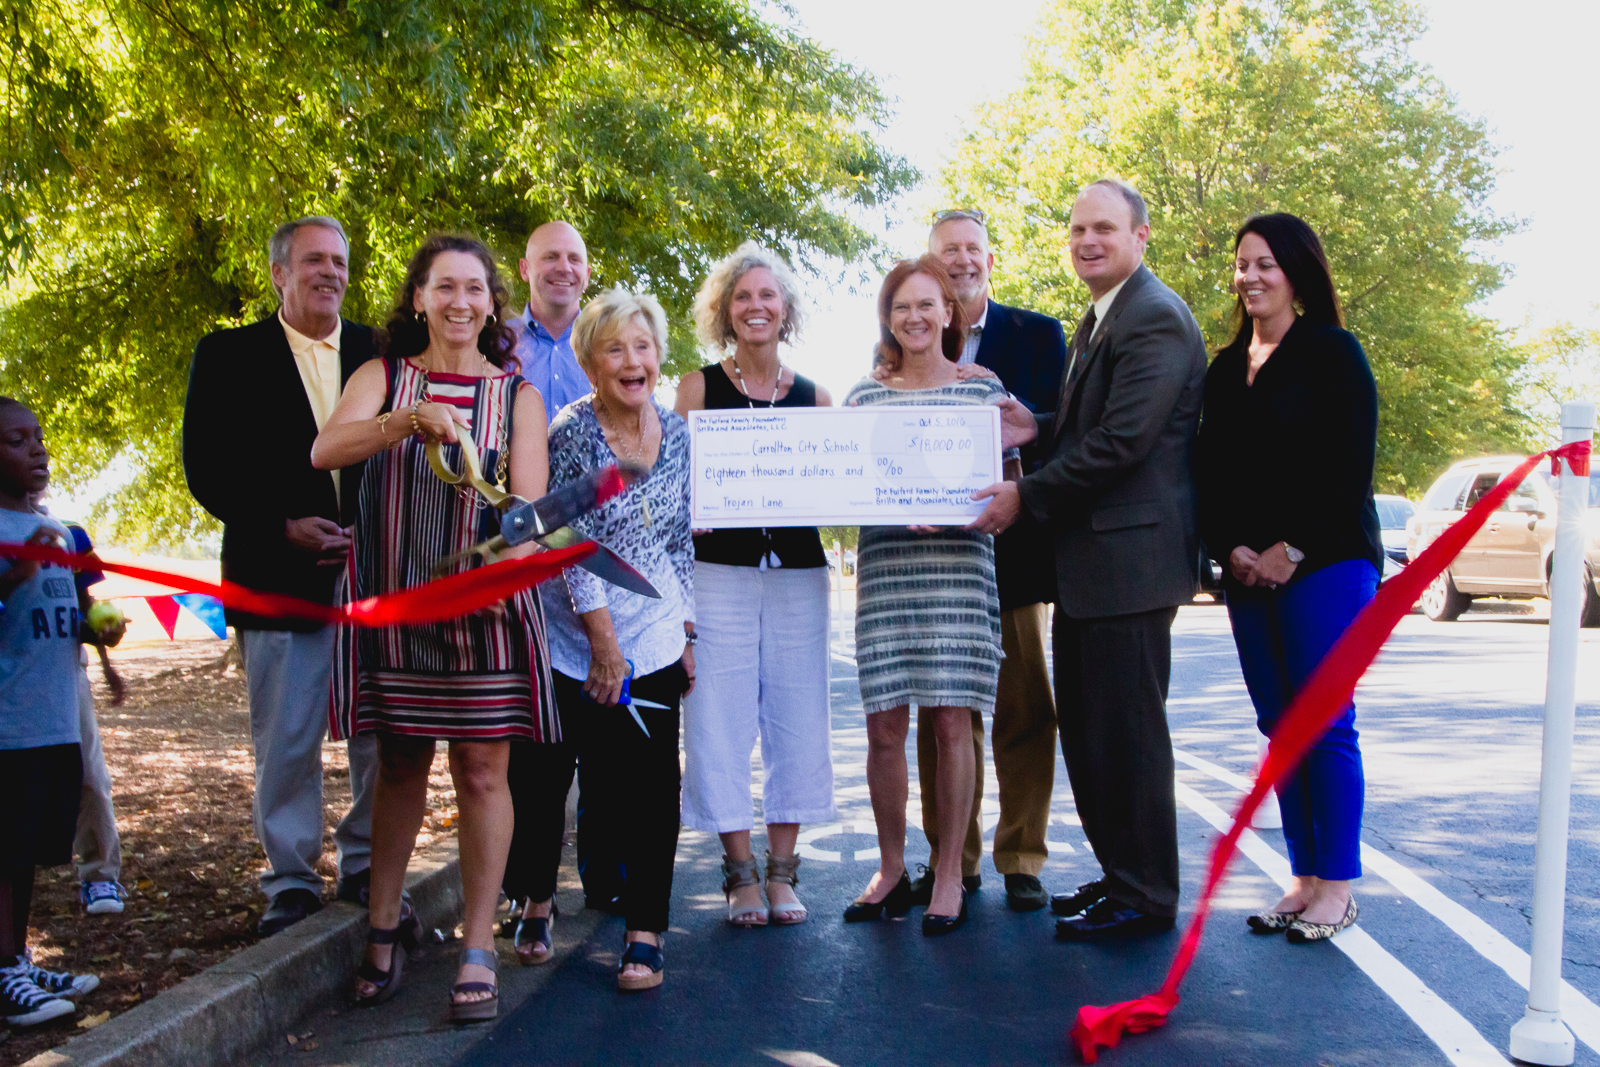
One of the suggestions – removing on street parking in front of the elementary school and providing a safe corridor for students to travel from the GreenBelt to the main entrance of the school was implemented in October 2016.
F10. What percentage of the community’s total annual transportation budget – on average over the last five fiscal years – was invested in bicycle projects?
The conservative answer to that questions is 68%. This number is a comparison of all the street improvement costs that covered road and sidewalk repairs, repaving and re-striping versus the costs of constructing the Carrollton GreenBelt, bringing in the Zagster Bike Share, purchasing speed feedback signs, installing the bike/ped Trojan Lane, streetscape improvements and crossing lights installation on Hwy 27. The road improvements are counted as a whole project and the portion spent on road diets, lane diets and striping the wide shoulders is not counted towards bike-friendly improvements.
- The 68% does not reflect projects undertaken by the University of West Georgia that added bike lanes around the campus and turned two of the campus streets into a bike friendly woonerf (Front Campus Drive) and a non-motorized vehicle boulevard (University Drive to Back Campus Drive).
- It also does not include the portion of the $1.22 million Community Transformation Grant (CTG) from CDC that went towards forming a Complete Streets Committee, Safe Routes to School Task Force and the Bike Share Committee. More on Tanner’s program:
Recognizing the barriers that prevent people from adopting healthy habits, Tanner Health System is leading the charge to address these critical needs in west Georgia. In 2012, Tanner was awarded a $1.22 million Community Transformation Grant (CTG) from the Centers for Disease Control and Prevention (CDC) to provide a lifeline to those most in need of assistance. Tanner was one of only eight hospitals in the country—and the only hospital in the southeast—to receive the award.
In recognition of these efforts, Tanner was named a “Public Health Hero” in 2013 by the Georgia Department of Public Health.
F11. Is bicycle-related funding specifically allocated to underrepresented areas of your community?
Approximately 25-percent of the Carrollton GreenBelt was constructed in underrepresented areas of the city. Over the previous 5 years, total bicycle infrastructure costs in these areas exceed $3.8 million.
F12 – F13. Evaluating Ridership
F12. How does your community collect information on bicycle usage? Check all that apply.
- Tanner Health Systems has recently purchased an ecocounter, infrared counting system, for use in future research.
-
Manual counts that include demographic data collection – please read about the study conducted by Dr. Lisa Gezon and published in Parks & Recreation Magazine -NRPA’s monthly magazine.
The Health Benefits of a Bicycle-Pedestrian Trail
- Parks & Recreation Magazine -NRPA’s monthly magazine
- Department, by Lisa L. Gezon, Emily McKendry-Smith and Anne Kristen Hunter (December 1, 2016)
- Article link
- Excerpt:
In f all 2015, a team of researchers from the University of West Georgia began a research project to explore the relationship between physical activity, perceptions of health and use of the GreenBelt. In a mixed-method approach, researchers asked whether and how the presence of the trail changed users’ participation in and attitudes toward physical activity. A team of four students handed out surveys at four separate, high-traffic locations on the GreenBelt and received 269 completed surveys. After a preliminary analysis of that data, 14 individuals were interviewed using a targeted set of questions.
Unexpectedly, researchers also discovered the importance, particularly for women, of the GreenBelt as a place to socialize and be with others.
Common perception: Trails = (physical activity = health) + socializing
Findings: Trails = (physical activity + socializing) = health
- Dr. Gezon is following up her original study with a new questionnaire that will cover a variety of data- how do people get to the trail? do they use it for fitness, commute? The questions also cover bicycle use in general, frequency of utilitarian trips together with their destinations, and overall rating of the trail, and demographic data. The survey will be conducted by University of West Georgia students over a course of 6 weeks, starting mid-February.
F12a. data collected
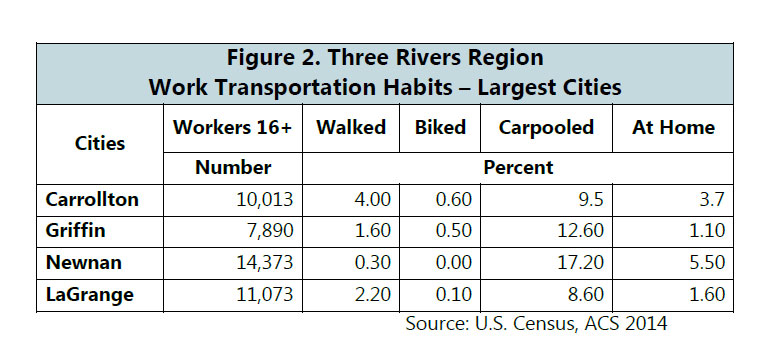
- 2010 U.S. Census: Carrollton, Georgia, workforce: 8,646, bike commuters: 42. Percentage of bike commuters: 0.49%
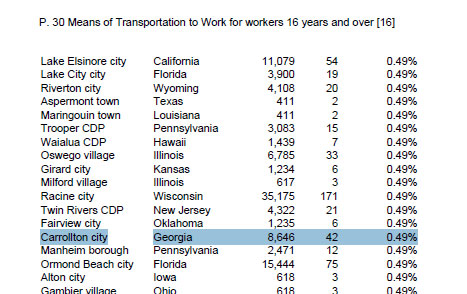
- U.S. Census, ACS 2014: Carrollton, Georgia, workforce: 10,013, bike commuters: 60. Percentage of bike commuters: 0.60%
- 54% of GreenBelt users are women. (Source: Dr. Gezon’s study)
-
Safe Routes to Shool data collection – 6% or 96 kids out of 1600 Carrollton Elementary School students regularly travels to school on foot or bike – per Phyllis Head of Get Healthy Live Well coalition of Tanner Health Systems. 150 children participated in the Walk&Roll to School Challenge.
-
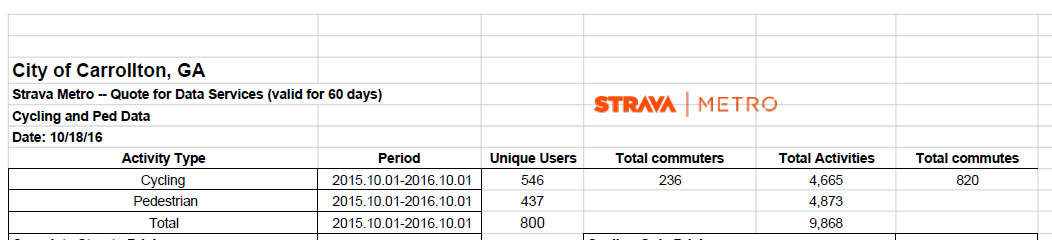
Strava Metro: registered users who at least once logged bike rides as “commutes”: 236. Percentage of bike commuters who registered with Strava and logged at least one commute-type ride: 2.36% We assume that only a percentage of bike commuters use Strava and that not everyone is commuting strictly by one means of transportation (strictly by bike or strictly by car) but we feel like part-time bike commute is on the rise, especially by looking at the use the public bike racks are getting.
-
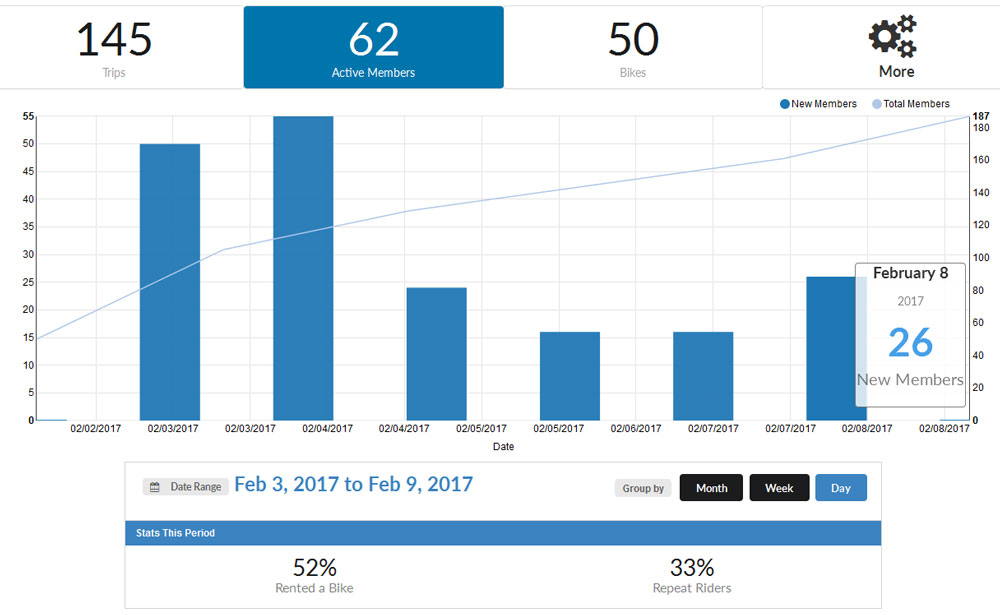
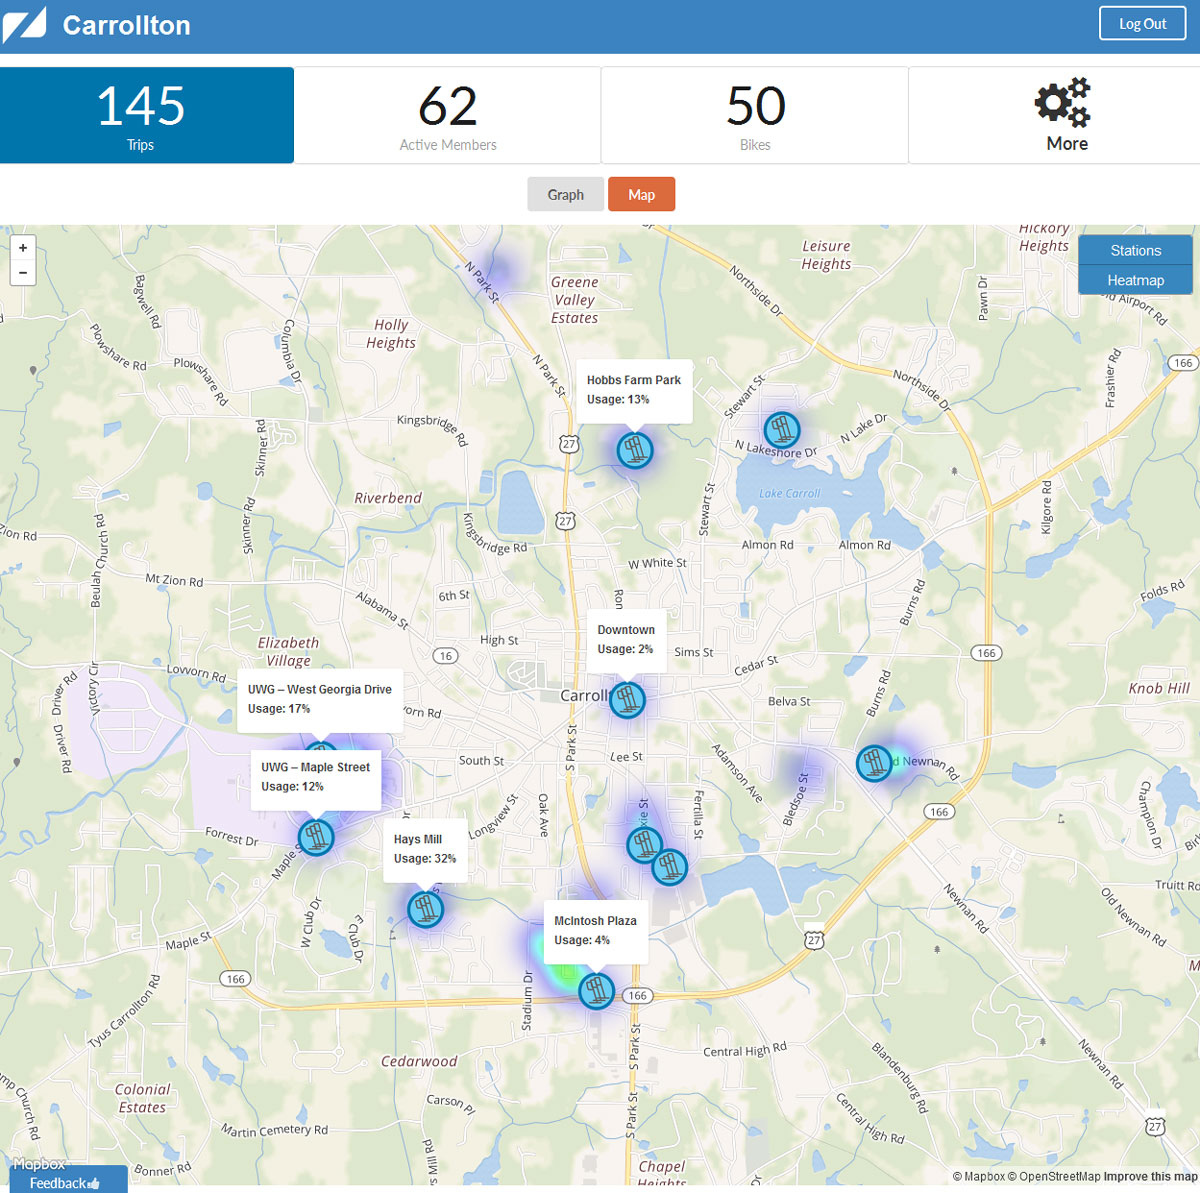
Zagster Dashboard: It is too early to have any conclusive data, yet, but we hope the Zagster Bike Share Fleet Dashboard will provide a useful tool to measure interest in biking and specific bicycling patterns. The Dashboard Sample findings from the fist 6 days of the system being active:
∴ Number of trips daily:
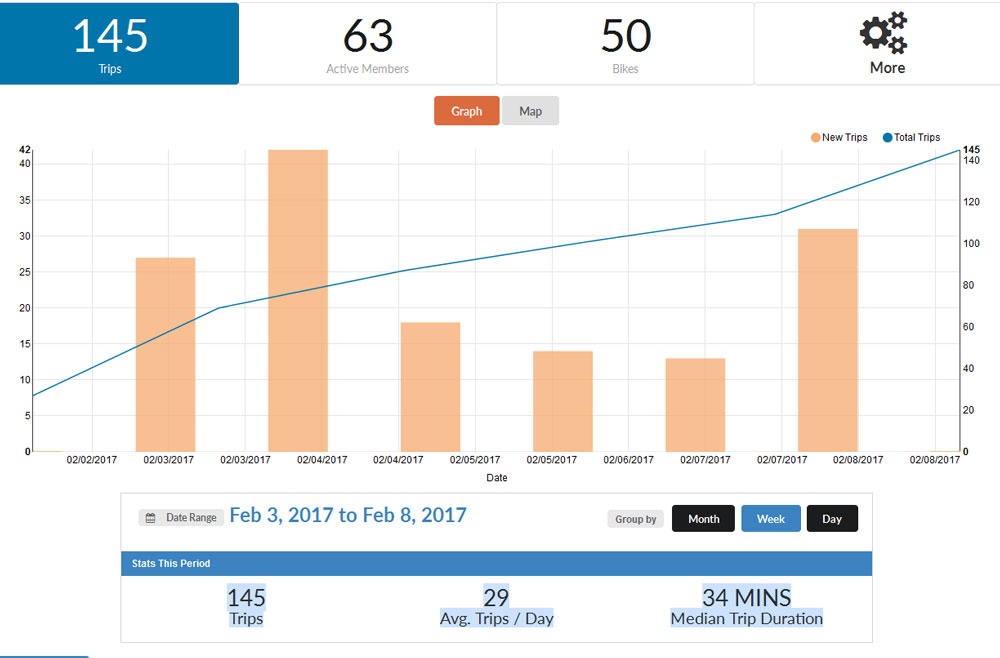
∴ Active members / new signups:
-
The annual bicycle event – Tour de Carroll attracts between 120 to 130 riders. October 2016 marked the event’s fourth year.
-
We also know that at least two local transition homes for men offer bicycles to their clients as a form of transportation. HOPE assists an average 65 to 70 men annually and they offer an internal bike share to clients going to work and to look for work. The Re-Entry program is for recently released felons trying to transition back into normal life. These bicycles are donated to men who find a job but have no transportation.
F14 – F16.
F16. How has your community conducted a network analysis to evaluate current conditions for bicyclists and identify significant infrastructure barriers to bicycling?
Strava Labs – Heatmaps: a very useful tool to measure changes in riding patterns upon completion of different sections of the Carrollton GreenBelt. There is a clear change of riding routes between 2014 and 2015. The real life findings can be compared against the proposed network from the Bicycle Planning ITG (page 4).
Visit Strava Labs – Heatmaps for Carrollton here.
2014 Heatmap:
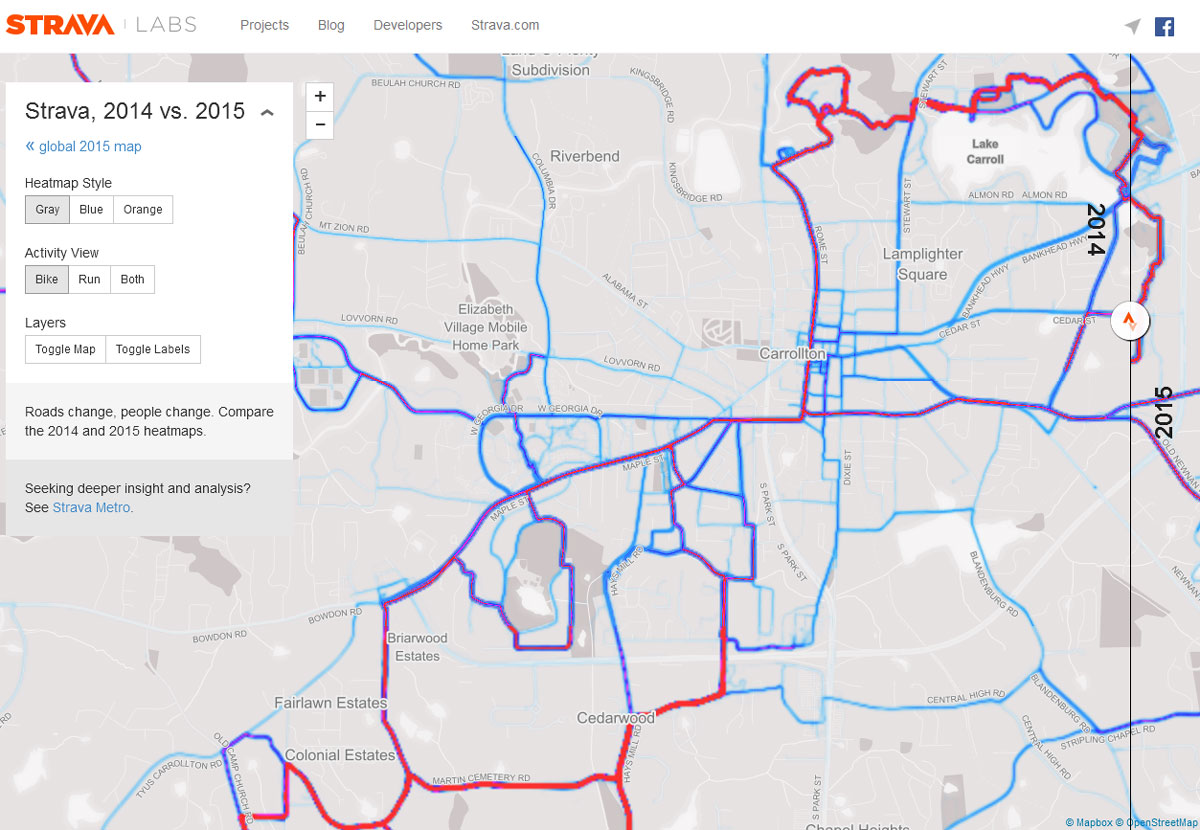
2015 Heatmap:
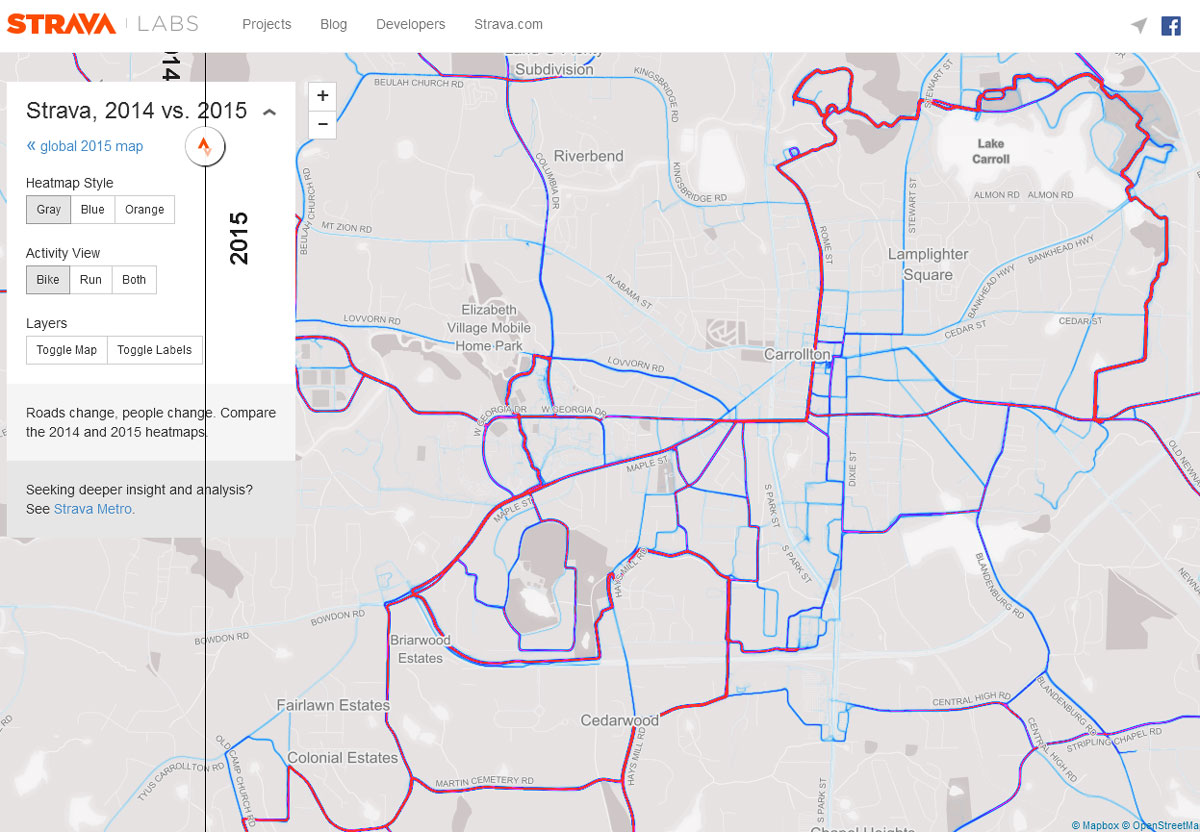
Proposed network:
-
Zagster Dashboard: It is too early to have any conclusive data, yet, but we hope the Zagster Bike Share Fleet Dashboard will provide a useful tool to measure interest in biking and specific bicycling patterns. The Dashboard Sample findings from the fist 6 days of the system being active:
∴ Usage heatmap / station use:
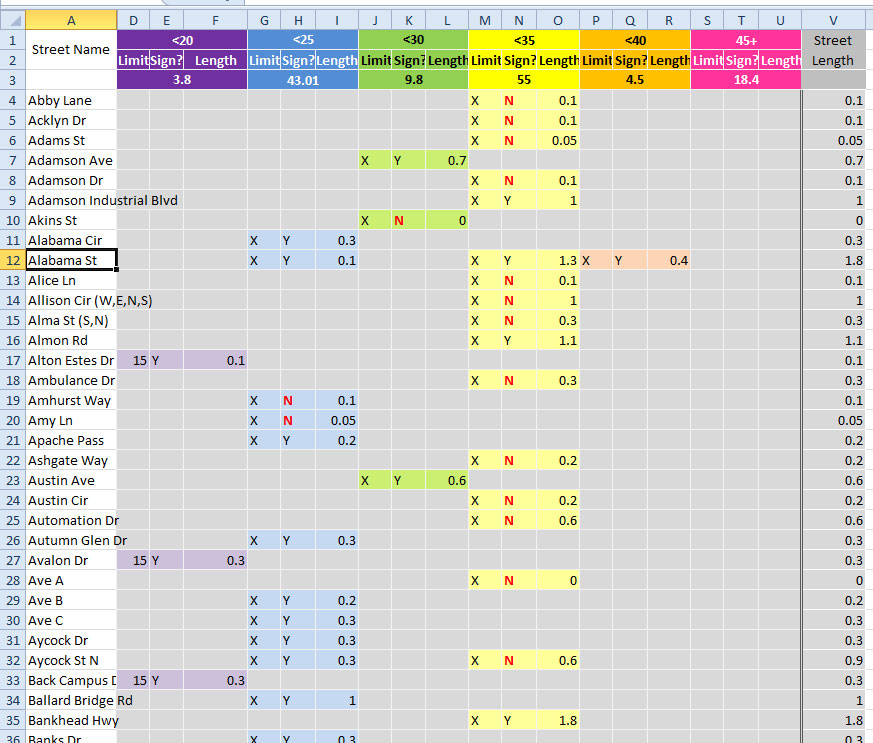
- Speed Limit Inventory – November 2016. Friend of Carrollton GreenBelt worked together with the City of Carrollton to produce a map of speed limits in town. The posted speed limits and streets with no posted speeds were noted in a spreadsheet by the FoCGB and the findings put on Carrollton’s street map by the Map Department of the City. This inventory is extremely useful in planning new signage, evaluating neighborhoods, and so on.
Length of streets with specific speed limits:
| mph | <20 mph | <25 | <30 | <35 | <40 | 45+ | ||||||||||||||
| miles | 3.8 | 43.01 | 9.8 | 55 | 4.5 | 18.4 |
Map of the speed limits:
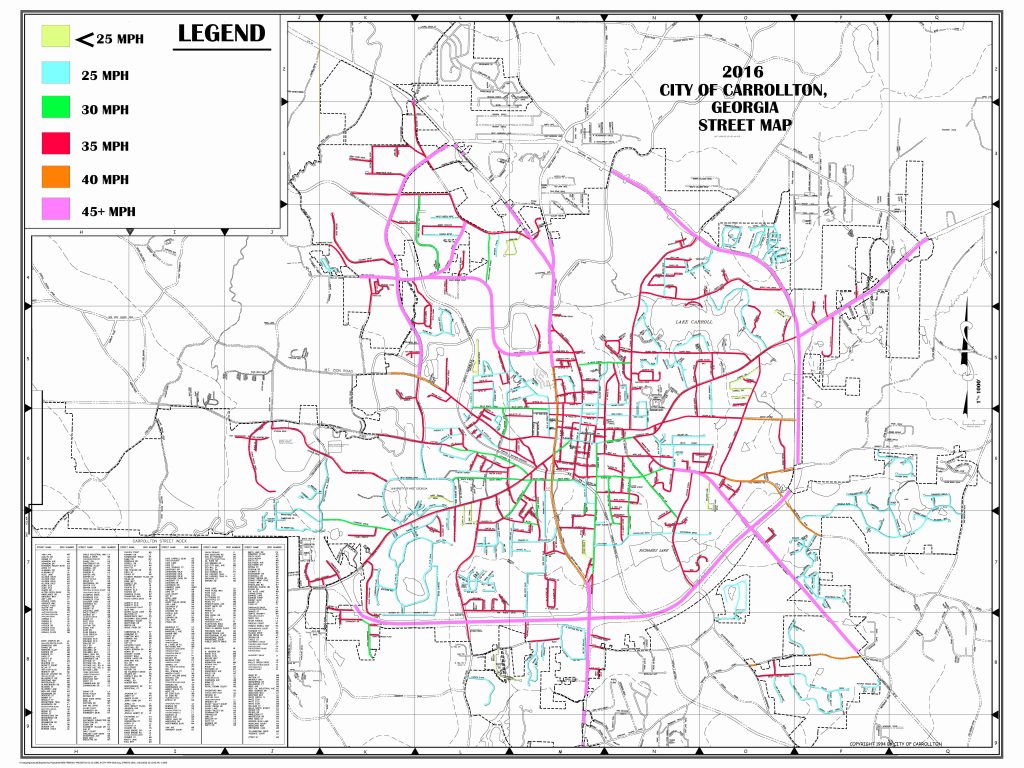
Speed limits inventory: